
More Information
Submitted: October 22, 2025 | Approved: October 29, 2025 | Published: October 30, 2025
How to cite this article: Hillman AK, Ramis P, Nielsen P, Swanston SN, Bonaminio D, Rohren EM. Breast Imaging Services Utilization Trends Across Private and Government-Insured Patients in a National Radiology Practice. J Clin Med Exp Images. 2025; 9(1): 020-027. Available from:
https://dx.doi.org/10.29328/journal.jcmei.1001037.
DOI: 10.29328/journal.jcmei.1001037
Copyright license: © 2025 Hillman AK, et al. This is an open access article distributed under the Creative Commons Attribution License, which permits unrestricted use, distribution, and reproduction in any medium, provided the original work is properly cited.
Keywords: Breast imaging examinations; Breast imaging service utilization; Private health insurance; Medicaid and medicare

Breast Imaging Services Utilization Trends Across Private and Government-Insured Patients in a National Radiology Practice
Andrew K Hillman1* , Phil Ramis2, Patrick Nielsen2, Sophia N Swanston3, Dana Bonaminio2 and Eric M Rohren1
1Baylor College of Medicine, Texas, USA
2Radiology Partners Research Institute, California, USA
3Texas A&M University, Texas, USA
*Address for Correspondence: Andrew K Hillman, Baylor College of Medicine, Texas, USA, Email: [email protected]
Purpose: To determine trends in breast imaging services utilization among privately and government-insured patients at a national radiology practice.
Method: Monthly breast imaging volume data from January 2019 to September 2022 were analyzed across five insurance types: three commercial carriers (Com1-Com3), Medicaid, and Medicare. Primary analysis involved calculating quarterly volumes and standard errors of the mean, followed by a joinpoint regression to identify trend inflection points and quarterly percentage changes (QPC). In the secondary analysis, the entire period trend was obtained and measured as the average quarterly percentage change (AQPC).
Results: Between 2019 Q1 and 2022 Q3, a total of 4,640,619 breast imaging services were accessed, including 2,034,833 2D screening mammograms, 1,640,689 screening digital breast tomosynthesis, 497,592 diagnostic mammograms, 452,549 breast ultrasounds, and 14,956 breast MRIs. AQPC values for imaging modalities varied across insurance types. Medicare and Medicaid patients showed the highest rates of utilization increases, particularly for modalities other than screening breast tomosynthesis, where private insurers dominated. Variations were observed between different commercial payors.
Conclusion: Breast imaging utilization increased among patients insured by Medicare and Medicaid from 2019 to 2022, outpacing that of those with private insurance. These findings contrast previous research suggesting better access and utilization among privately insured individuals, highlighting increased access for government-insured patients in this study.
In the last few decades, there have been tremendous advances in breast imaging, with the transition to screening digital mammography and digital breast tomosynthesis (DBT) providing high-quality images for interpretation [1]. There was debate over the impact of radiation exposure through mammographic screening, leading to the development of specific guidelines for breast cancer screening in the asymptomatic population [1]. Additionally, the introduction of the Breast Imaging Reporting and Data System (BI-RADS) has helped standardize breast imaging reports and added consistency to the categorization and follow-up of breast imaging studies [1-3]
Today in the United States, there are more breast imaging centers with upgraded imaging machines and technology than ever. Current data strongly indicate a rapid shift towards digital and 3D mammography technology. Byfield, et al. documented a dramatic increase in digital breast tomosynthesis (DBT) usage, rising from 23% of screening mammograms in 2016 to 82% by 2020 [4]. Boroumand, et al. earlier noted digital mammography was present in approximately 14% of facilities [5]. Facilities are increasingly preferring the use of DBT, which is expected to eventually supplant digital mammography as the gold standard imaging modality for breast cancer diagnosis. This is because DBTs tend to have lower recall and false positive rates than digital mammography [6].
Women now have more access to a range of screening and diagnostic breast imaging services and advanced breast cancer treatment. However, limiting factors still exist, such as the location of healthcare facilities, travel distance, as well as the type and coverage plan of a patient’s medical insurance [7,8]. For example, some specialists may be less willing to accept Medicaid patients than those on commercial insurance [8].
Evaluating trends through comparisons of patient demographics and breast imaging services could offer valuable insights for reassessing institutional practices that hinder access to services. This analysis not only provides valuable insight into recent trends in patient care and access by patient insurance type but also serves as a useful tool for forecasting future trends [9]. Such foresight enables radiology practices, facilities, and institutions to adequately plan for anticipated changes in trends, including financial budgeting, recruitment of workers, and the expansion or downsizing of services and facilities in specific locations [9]. Moreover, trend data can assist imaging facilities in tracking the progress of institutional and national goals aimed at early breast cancer diagnosis and management [9].
Our study identified trends in the use of specific diagnostic and screening breast imaging examinations among some privately insured and government-insured patients at a national radiology practice over four years.
Data source and design
This was a serial cross-sectional study evaluating monthly data on breast imaging services volumes, beginning January 2019 through September 2022, from a national radiology practice. The practice performs approximately 52 million radiologic procedures annually at 121 imaging centers in all 50 states in the US. For this study, we narrowed the focus to breast imaging examinations at 75 sub-practices within the practice’s network.
The breast imaging studies evaluated in this study and their corresponding American Medical Association (AMA) Current Procedural Terminology (CPT) codes (Table 1) consisted of ultrasound of the breast (CPT codes 76641, 76642), magnetic resonance imaging (MRI) of the breast (CPT codes 77046, 77047, 77048, 77049), diagnostic mammography (DM) (CPT codes 77065, 77066), 2D screening mammography (CPT code 77067), and screening digital breast tomosynthesis (DBT) (CPT code 77063) [10].
| Table 1; Breast imaging procedures and corresponding Current Procedural Terminology (CPT) codes used in the study. | |
| Services/Procedures | CPT codes |
| Ultrasound, breast, unilateral, real-time with image documentation, including axilla when performed; complete | 76641 |
| Ultrasound, breast, limited, real-time with image documentation, including axilla when performed; limited | 76642 |
| Magnetic resonance imaging, breast, without contrast material; unilateral | 77046 |
| Magnetic resonance imaging, breast, without contrast material; bilateral | 77047 |
| Magnetic resonance imaging, breast, without and with contrast material(s), including computer-aided detection (CAD) [CAD real-time lesion detection, characterization, and pharmacokinetic analysis], when performed, unilateral. | 77048 |
| Magnetic resonance imaging, breast, without and with contrast material(s), including CAD (CAD real-time lesion detection, characterization, and pharmacokinetic analysis), when performed; bilateral | 77049 |
| Screening digital breast tomosynthesis, bilateral | 77063 |
| Diagnostic mammography, including CAD when performed, unilateral | 77065 |
| Diagnostic mammography, including CAD when performed, bilateral | 77066 |
| Screening mammography, bilateral (two-view study of each breast), including CAD when performed | 77067 |
| Reference: List of CPT/HCPCS Codes. https://www.cms.gov/Medicare/Fraud-and-Abuse/PhysicianSelfReferral/List_of_Codes. | |
Trends in utilization for each of these breast imaging services were evaluated over the 45 months for patients insured by three private companies (designated in this study as Com1, Com2, and Com3) and two governmental programs (Medicaid and Medicare).
The three private insurers were selected because they represented the largest providers of health insurance by patient enrollment within the study dataset, accounting for approximately 58.6% of all patients who received breast imaging services during the study period at this practice. The study was determined to be exempt from institutional review board (IRB) approval by the Baylor College of Medicine IRB.
Study variables
Analysis began by deidentifying the monthly data volumes of the five breast imaging modalities and documenting the insurance payor details. The quarterly mean volumes and standard errors of each breast imaging service and insurance type were then calculated using STATA version 18.0 [11].
Statistical analysis
In the primary analysis of this study, we evaluated trends of the average quarterly volumes for each of the breast imaging modalities, stratified by the patient insurance payor. Points of inflection (joinpoints) in the longitudinal data and trend changes, measured as the quarterly percentage change, between segments of the time series were identified using a joinpoint regression. For the secondary analysis, we evaluated the overall trend, represented by the average quarterly percentage change, from the first quarter (Q1) of 2019 (2019Q1) to the third quarter (Q3) of 2022 (2022Q3) by again using joinpoint regression.
A joinpoint regression was performed using a Joinpoint Regression Program version 5.0.1 [12]. The average quarterly volume of each modality was set as the dependent variable, and the quarter of each year was used as the independent variable. The standard error of the mean was set as the uncorrelated error option, and the insurance payor type was listed as the by variable/cohort. The maximum number of joinpoints was set at 4. We used a permutation test as the model selection method, with the overall significance level set at 0.05 and the number of permutations set at 4499. An empirical quantile was used in calculating the Quarterly Percentage Change (QPC) and the Average Quarterly Percentage Change (AQPC) for the final selected model. The identification of joinpoint(s) and the number of joinpoints selected are based on the final best-fit model selected (Table 2). A graph of the observed and calculated quarterly mean volumes of imaging modality by the insurance payor was plotted (Figures 1 to 5) using STATA version 18.0 [11].
| Table 2: Joinpoint regression results showing quarterly percentage changes (QPC) and trend inflection points in breast imaging service volumes by insurance type, 2019Q1–2022Q3. | ||||||||||
| Trend 1 | Trend 2 | Trend 3 | Trend 4 | Trend 5 | ||||||
| Breast Imaging Service | QPC, % (95% CI) | Year and Quarter | QPC, % (95% CI) | Year and Quarter | QPC, % (95% CI) | Year and Quarter | QPC, % (95% CI) | Year and Quarter | QPC, % (95% CI) | Year and Quarter |
| Diagnostic Mammography | ||||||||||
| COM1 | 0.10 (-2.89 to 2.84) | 2019Q1-2020Q1 | 18.86* (2.05 to 29.07) | 2020Q1-2020Q4 | -0.32 (-1.01 to 0.25) | 2020Q4-2022Q3 | NA | NA | NA | NA |
| COM2 | 9.20* (5.59 to 47.55) | 2019Q1-2020Q4 | 1.73 (-5.82 to 4.00) | 2020Q4-2022Q3 | NA | NA | NA | NA | NA | NA |
| COM3 | -0.63* (-0.92 to -0.28) | 2019Q1-2022Q3 | NA | NA | NA | NA | NA | NA | NA | NA |
| MEDICAID | 0.88 (-0.36 to 2.07) | 2019Q1-2020Q1 | 16.22* (12.68 to 20.38) | 2020Q1-2020Q4 | *2.15 (1.95 to 2.40) | 2020Q4-2022Q3 | NA | NA | NA | NA |
| MEDICARE | 4.15* (2.62 to 6.45) | 2019Q1-2020Q4 | 0.73 (-1.06 to 1.52) | 2020Q4-2022Q3 | NA | NA | NA | NA | NA | NA |
| Breast MRI | ||||||||||
| COM1 | -3.75* (-7.29 to -1.65) | 2019Q1-2020Q1 | 28.25* (4.08 to 43.13) | 2020Q1-2020Q4 | 0.69 (-0.39 to 1.43) | 2020Q4-2022Q3 | NA | NA | NA | NA |
| COM2 | 5.58* (3.37 to 35.63) | 2019Q1-2021Q4 | -1.53 (-11.16 to 2.76) | 2021Q4-2022Q3 | NA | NA | NA | NA | NA | NA |
| COM3 | 17.20* (10.42 to 34.04) | 2019Q1-2019Q4 | -6.69* (-10.05 to -3.30) | 2019Q4-2020Q3 | 2.63* (0.22 to 6.47) | 2020Q3-2022Q3 | NA | NA | NA | NA |
| MEDICAID | 0.72 (-0.23 to 1.89) | 2019Q1-2020Q1 | 24.02* (19.49 to 27.40) | 2020Q1-2020Q4 | 2.43* (2.21 to 3.02) | 2020Q4-2022Q3 | NA | NA | NA | NA |
| MEDICARE | 6.82* (4.45 to 42.73) | 2019Q1-2020Q4 | 1.80 (-28.26 to 3.15) | 2020Q4-2022Q3 | NA | NA | NA | NA | NA | NA |
| Screening DBT | ||||||||||
| COM1 | 6.08* (3.19 to 10.66) | 2019Q1-2020Q4 | 0.02 (-22.53 to 1.43) | 2020Q4-2022Q3 | NA | NA | NA | NA | NA | NA |
| COM2 | 45.83* (28.21 to 94.70) | 2019Q1-2019Q4 | 3.09* (2.28 to 5.94) | 2019Q4-2021Q4 | -1.52 (-32.15 to 0.36) | 2021Q4-2022Q3 | NA | NA | NA | NA |
| COM3 | 19.36* (14.56 to 33.28) | 2019Q1-2019Q4 | 2.65* (2.39 to 3.29) | 2019Q4-2022Q3 | NA | NA | NA | NA | NA | NA |
| MEDICAID | 18.19* (11.20 to 26.67) | 2019Q1-2019Q3 | 6.20* (3.81 to 7.90) | 2019Q3-2020Q2 | -1.61 (-3.23 to 0.76) | 2020Q2-2021Q1 | 12.62* (10.08 to 16.53) | 2021Q1-2021Q4 | -1.42* (-3.15 to -0.57) | 2021Q4-2022Q3 |
| MEDICARE | 0.52 (-0.51 to 1.51) | 2019Q1-2022Q3 | NA | NA | NA | NA | NA | NA | NA | NA |
| Screening Mammography | ||||||||||
| COM1 | 4.32* (2.09 to 28.53) | 2019Q1-2020Q4 | -0.35 (-28.45 to 0.74) | 2020Q4-2022Q3 | NA | NA | NA | NA | NA | NA |
| COM2 | 10.04* (8.37 to 14.19) | 2019Q1-2020Q4 | -0.58 (-2.19 to 0.97) | 2020Q4-2022Q3 | NA | NA | NA | NA | NA | NA |
| COM3 | -0.62* (-1.27 to -0.003) | 2019Q1-2022Q3 | NA | NA | NA | NA | NA | NA | NA | NA |
| MEDICAID | 11.66* (9.83 to 13.28) | 2019Q1-2019Q4 | 2.10* (1.97 to 2.51) | 2019Q4-2022Q3 | NA | NA | NA | NA | NA | NA |
| MEDICARE | 2.80* (2.59 to 3.65) | 2019Q1-2021Q4 | -1.48* (-31.90 to -0.02) | 2021Q4-2022Q3 | NA | NA | NA | NA | NA | NA |
| Breast Ultrasound | ||||||||||
| COM1 | 0.75 (-1.88 to 3.02) | 2019Q1-2020Q1 | 14.01* (1.59 to 20.89) | 2020Q1-2020Q4 | 0.32 (-0.01 to 0.73) | 2020Q4-2022Q3 | NA | NA | NA | NA |
| COM2 | 34.24* (28.37 to 76.87) | 2019Q1-2019Q4 | 2.28* (1.61 to 2.66) | 2019Q4-2022Q3 | NA | NA | NA | NA | NA | NA |
| COM3 | -0.95* (-1.23 to -0.67) | 2019Q1-2022Q3 | NA | NA | NA | NA | NA | NA | NA | NA |
| MEDICAID | 1.74 (-0.04 to 3.89) | 2019Q1-2020Q1 | 12.14* (2.61 to 17.77) | 2020Q1-2020Q4 | 2.14* (1.58 to 2.58) | 2020Q4-2022Q3 | NA | NA | NA | NA |
| MEDICARE | 14.83* (11.66 to 21.00) | 2019Q1-2019Q4 | 2.24* (1.92 to 2.88) | 2019Q4-2022Q3 | NA | NA | NA | NA | NA | NA |
| Abbreviations: QPC = quarterly percentage change; NA = not applicable; DBT = Digital breast tomosynthesis; MRI = Magnetic resonance imaging *Significance at p < .05. |
||||||||||
Between 2019 Q1 and 2022 Q3, the total volume of breast imaging services accessed by Com1, Com2, Com3, Medicare, and Medicaid-insured patients was 4,640,619. This total consisted of 2,034,833 2D screening mammography, 1,640,689 screening digital breast tomosynthesis, 497,592 diagnostic mammography, 452,549 breast ultrasound, and 14,956 breast MRI examinations. It is unknown if any of these examinations were on the same patient.
Table 1 presents the specific breast imaging studies and their corresponding CPT codes included in our analysis. Tables 2,3 show the inflection points and trends in imaging examinations approved by the five different health insurances over time. Table 3 specifically focuses on the trend in breast imaging exam approvals throughout the entire study period. Figure 1 illustrates the color-coded labeling used to distinguish between modeled and observed data based on insurer type. Figures 2-6 represent the observed and modeled service volumes by breast imaging exam type and patient insurance type.
| Table 3: Average Quarterly Percentage Change (AQPC) in breast imaging service utilization by insurance type, 2019Q1–2022Q3. | |
| Average Quarterly Percentage Change (AQPC), (95% CI) | |
| Breast Imaging Service | Entire period (2019Q1-2022Q3) |
| Diagnostic Mammography | |
| COM1 | 1.48* (1.17 to 1.71) |
| COM2 | 4.70* (2.35 to 6.47) |
| COM3 | -0.63* (-0.92 to -0.28) |
| MEDICAID | 2.99* (2.83 to 3.21) |
| MEDICARE | 2.10* (1.63 to 2.50) |
| Breast MRI | |
| COM1 | 1.56* (1.12 to 1.92) |
| COM2 | 3.53* (2.62 to 5.85) |
| COM3 | 1.17* (0.02 to 2.48) |
| MEDICAID | 3.74* (3.57 to 4.09) |
| MEDICARE | 3.81* (2.23 to 5.40) |
| Screening DBT | |
| COM1 | 2.44* (1.08 to 3.07) |
| COM2 | 5.14* (3.64 to 6.38) |
| COM3 | 4.11* (3.85 to 4.84) |
| MEDICAID | 3.04* (2.49 to 3.49) |
| MEDICARE | 0.52 (-0.51 to 1.51) |
| Screening Mammography | |
| COM1 | 1.52 (-0.08 to 2.58) |
| COM2 | 3.61* (2.93 to 4.28) |
| COM3 | -0.62* (-1.27 to -0.003) |
| MEDICAID | 2.96* (2.85 to 3.06) |
| MEDICARE | 1.58* (0.25 to 2.11) |
| Breast Ultrasound | |
| COM1 | 1.67* (1.52 to 1.91) |
| COM2 | 4.92* (4.23 to 5.93) |
| COM3 | -0.95* (-1.23 to -0.67) |
| MEDICAID | 2.91* (2.67 to 3.07) |
| MEDICARE | 3.36* (3.15 to 3.74) |
| Abbreviations: AQPC= Average quarterly percentage change; DBT=Digital breast tomosynthesis, MRI= Magnetic resonance imaging *Significance at p < .05. |
|
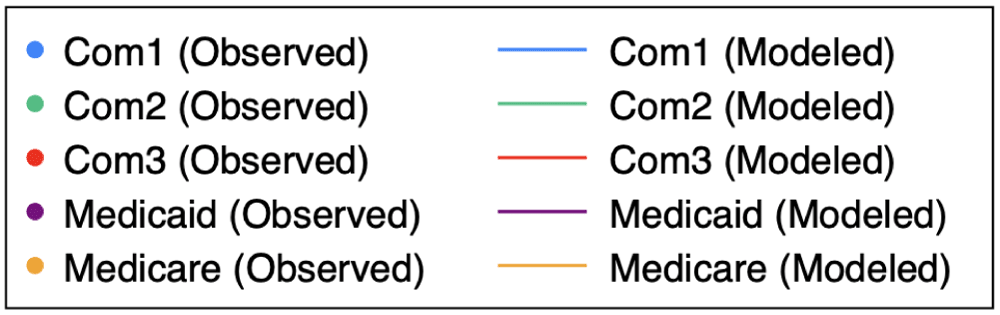
Figure 1: Shows color labeling for modeled and observed data by insurer type.
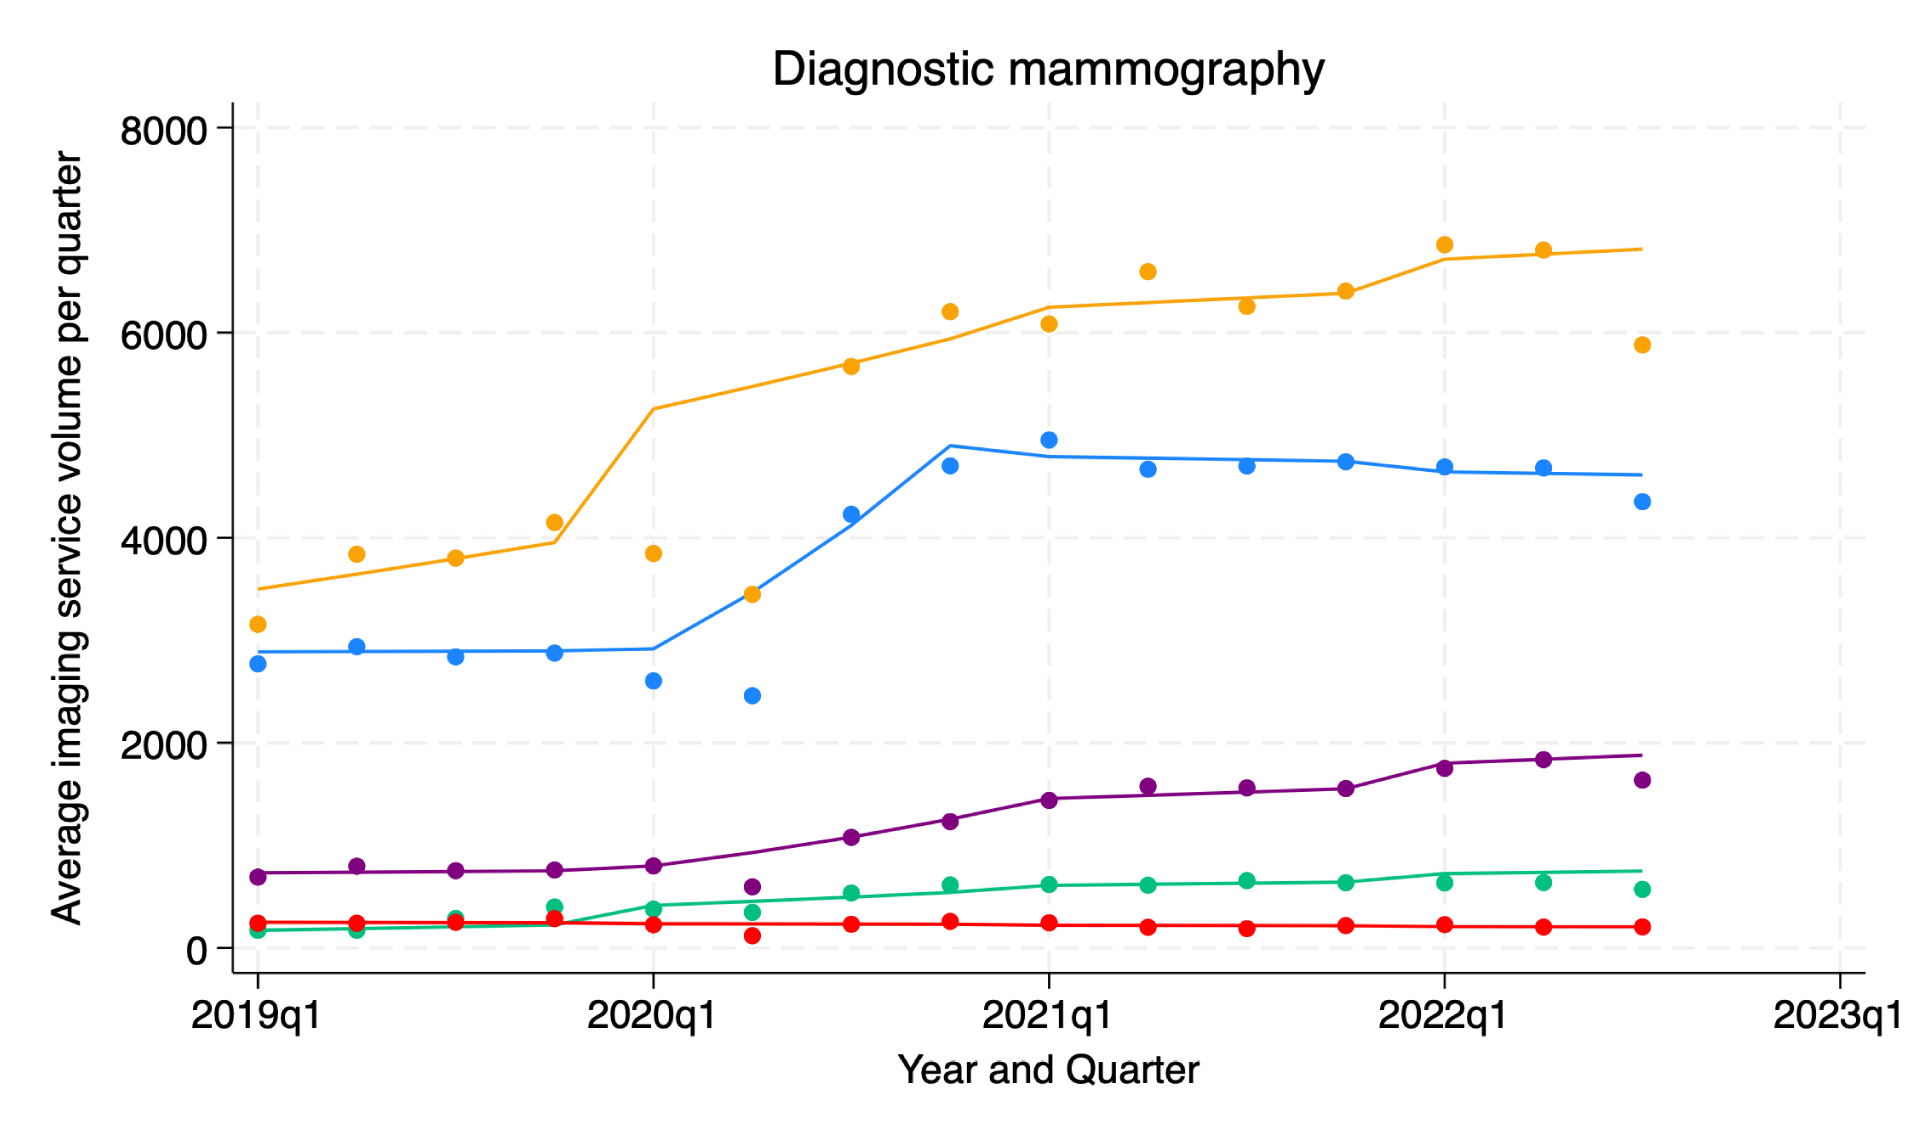
Figure 2: Trends in diagnostic mammography service volumes (2019Q1–2022Q3) by insurer type.
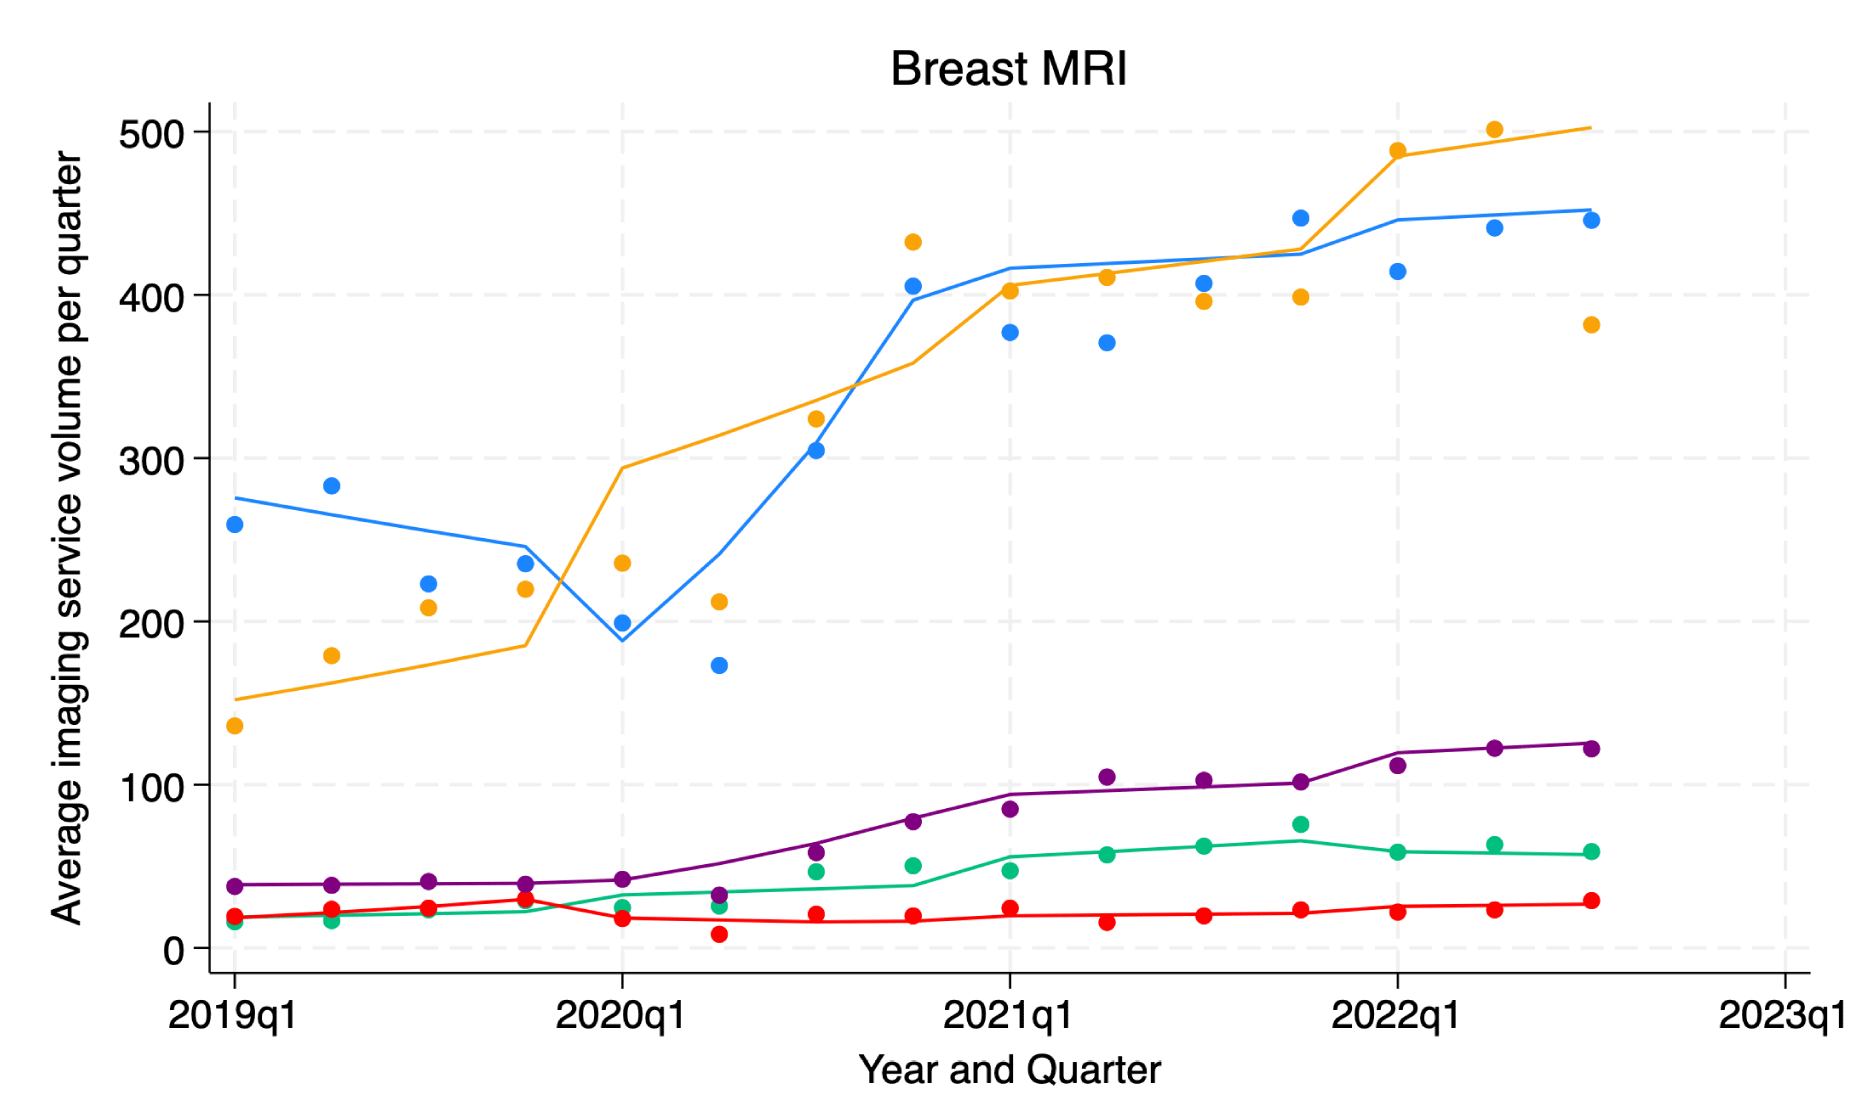
Figure 3: Trends in breast MRI service volumes (2019Q1–2022Q3) by insurer type.
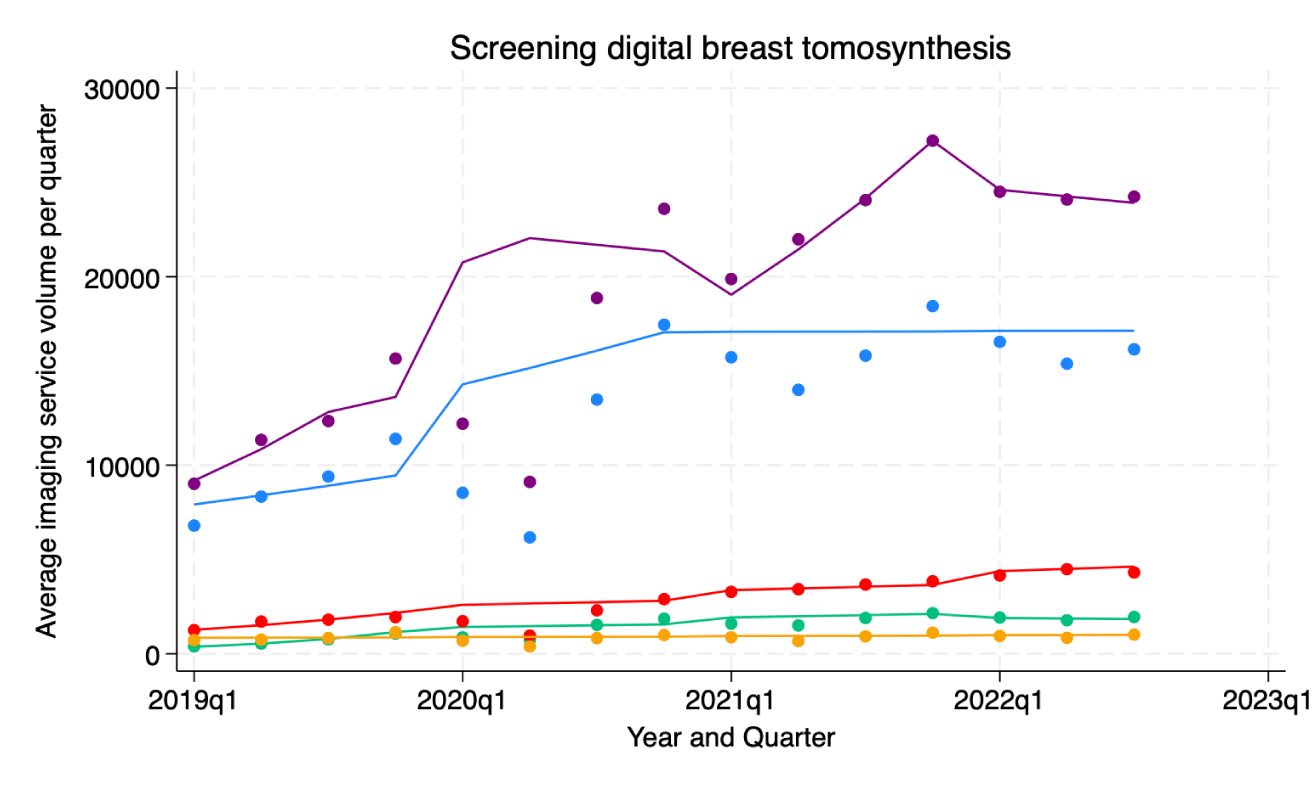
Figure 4: Trends in screening digital breast tomosynthesis (DBT) service volumes (2019Q1–2022Q3) by insurer type.
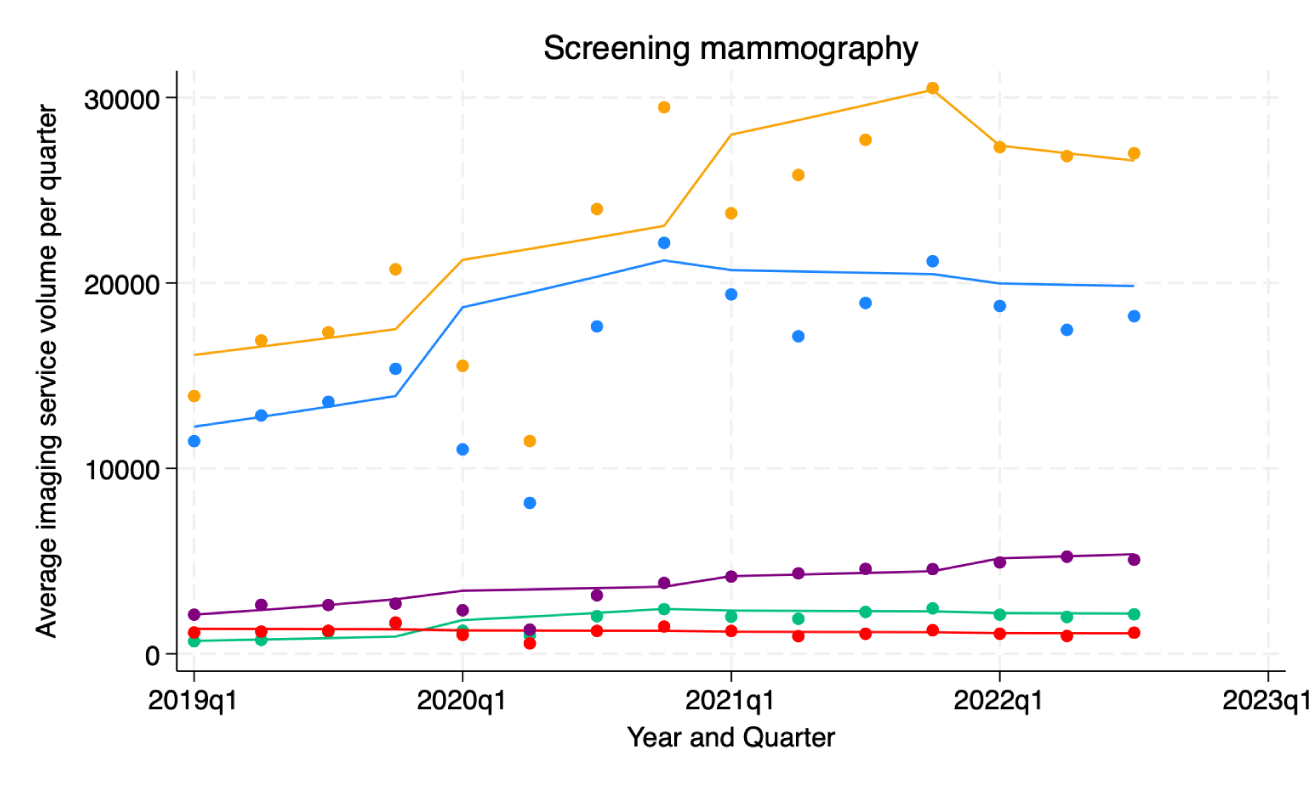
Figure 5: Trends in 2D screening mammography service volumes (2019Q1–2022Q3) by insurer type.
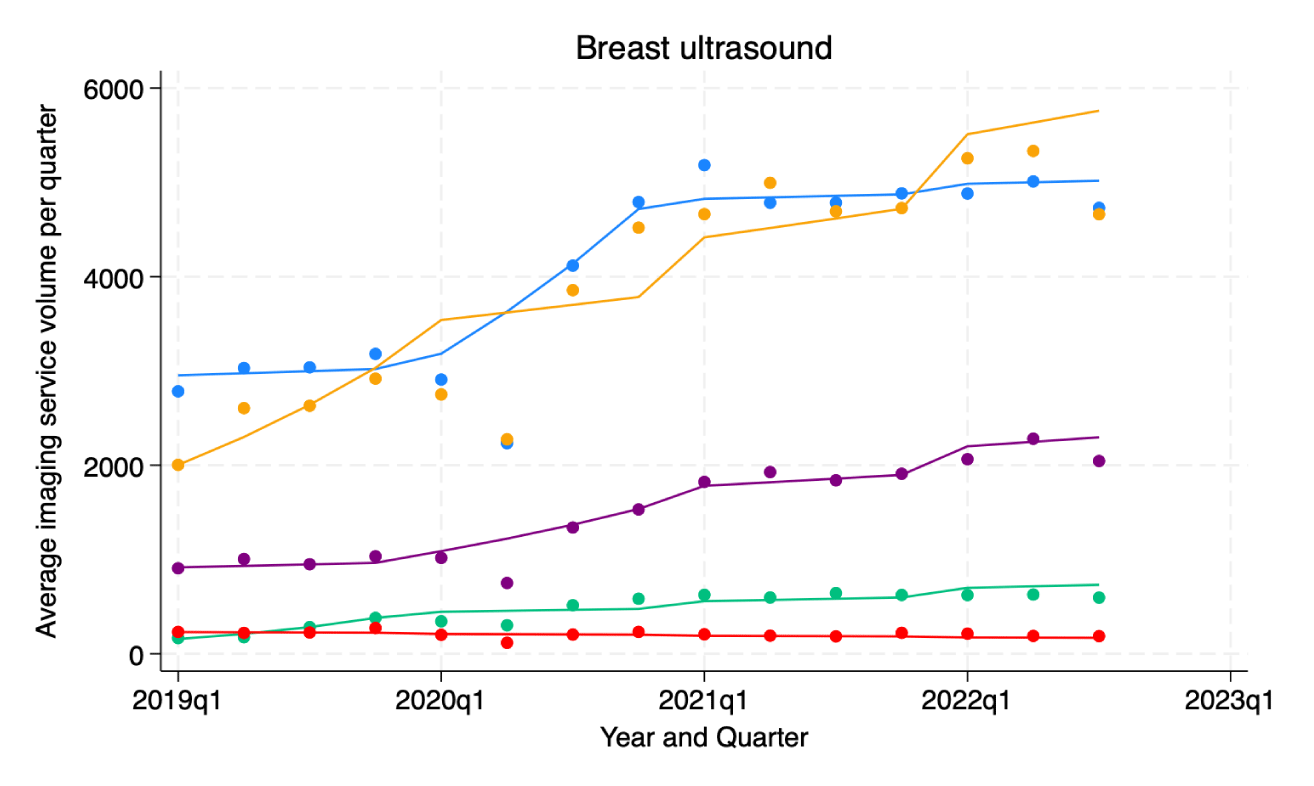
Figure 6: Trends in breast ultrasound service volumes (2019Q1–2022Q3) by insurer type.
Diagnostic mammography
From 2019 Q1 to 2022 Q3, the 2D diagnostic mammography (DM) volumes by patient insurance payor type are as follows: Com 1 (174,594), Com 2 (21,801), Com 3 (10,027), Medicaid (54,187), and Medicare (236,983).
Com1’s data shows there are inflection points in the 2020 Q1 and 2020 Q2 for the DM service volumes. The quarterly percentage change (QPC) in DM service volumes was 0.10% from 2019 Q1 to 2020 Q1, 18.86% from 2020 Q1 to 2020 Q4, and a reversal of -0.32% from 2020 Q4 to 2022 Q3. AQPC for the entire period (from 2019Q1 to 2022Q3) was 1.48%. Patients on Com2 had one inflecting point in the service volume trend in 2020 Q4. The QPC was 9.20% from 2019 Q1 to 2020 Q4, and a decline to 1.73% from 2020 Q4 to 2022 Q3. AQPC for the entire period was 4.70%. Com 3 didn’t have trend changes in DM service volumes for Com 3 patients for the entire period (AQPC of -0.63% from 2019Q1 to 2022Q3)
Medicaid-insured patients had inflection points in 2020 Q1 and 2020 Q4. The QPC was 0.88% from 2019 Q1 to 2020 Q1, to 16.22 % from 2020 Q1 to 2020 Q4, followed by a decline to 2.15% from 2020 Q4 to 2020 Q3. AQPC for the entire period was 2.99%. Service volumes for Medicare patients had a single inflection point in 2020 Q4. Medicare patients who utilized DM services had a QPC of 4.15% from 2019 Q1 to 2020 Q4 and 0.73% from 2020 Q4 to 2022 Q3. The entire period’s AQPC was 2.10%.
Breast MRI
From 2019 Q1 to 2022 Q3, the breast MRI volumes by patient insurance payor type are as follows: Com 1 (14,956) for Com1, 1,967 for Com2, 964 for Com3, 3,347 for Medicaid, and 14,778 for Medicare.
There were inflection points in 2020 Q1 and 2020 Q4 in breast MRI service volume by Com1 patients. The QPC was -3.75% from 2019 Q1 to 2020 Q1, 28.25% from 2020 Q1 to 2020 Q4, and 0.69% from 2020 Q4 to 2022 Q3. The AQPC was 1.56% for the entire period. Com2 patients had inflection points in their service volume in 2021 Q4, with a QPC of 5.58% from 2019 Q1 to 2021 Q4, and followed by a trend reversal with a QPC of -1.53% from 2021 Q4 to 2022 Q3. The AQPC was 3.53% for the entire period. Service volumes for Com3 patients had inflection points in 2019 Q4 and 2020 Q3, with a QPC of 17.20% from 2019 Q1 to 2019 Q4 and a trend reversal with a QPC of -6.69% from 2019 Q4 to 2020 Q3 and reversal again by 2.63% from 2020 Q3 to 2022 Q3. The AQPC was 1.17% for the entire period.
Medicaid patients had inflection points in 2020 Q1 and 2020 Q4, with a QPC of 0.72% from 2019 Q1 to 2020 Q1, 24.02% from 2020 Q1 and 2020 Q4, and 2.43% from 2020 Q4 to 2022 Q3. The AQPC was 3.74% for the entire period. Medicare patients had a single inflection point for breast imaging service volumes in 2020 Q4. The QPC was 6.82% from 2019 Q1 to 2020 Q4 and 1.80% from 2020 Q4 to 2022 Q3. The AQPC was 3.81% for the entire period.
Screening digital breast tomosynthesis
From 2019 Q1 to 2022 Q3, the screening digital breast tomosynthesis volumes by patient insurance payor type are as follows: Com1 (580,836), Com 2 (61,788), Com 3 (125,393), Medicaid (834,328), and Medicare (38,344).
Com1 patients had a single inflection point for screening digital breast tomosynthesis (DBT) services volumes in 2020 Q4; QPC was 6.08% from 2019 Q1 to 2020 Q4 and 0.02% from 2020 Q4 and 2022 Q3. AQPC was 2.44% for the entire period. Com2 patients had two inflection points in 2019 Q4 and 2021 Q4 in service volumes; the QPC was 45.83% from 2019 Q1 to 2019 Q4, 3.09% from 2019 Q4 to 2021 Q4, and -1.52% from 2021 Q4 to 2022 Q3. The AQPC was 5.14% for the entire period. Service volumes by Com3 patients had an inflection point in 2019 Q4; a QPC of 19.36% from 2019 Q1 to 2019 Q4 and 2.65% from 2019 Q4 to 2022 Q3. The AQPC was 4.11% for the entire period.
Medicaid patients had four inflection points in service volumes: in 2019 Q3, 2020 Q2, 2021 Q1, and 2021 Q4. The QPC was 18.19% from 2019 Q1 to 2019 Q3, 6.20% from 2019 Q3 to 2020 Q2, -1.61% from 2020 Q2 to 2021 Q1, 12.62% from 2021 Q1 to 2021 Q4, and -1.42% from 2021 Q4 to 2021 Q4 to 2022 Q3. The AQPC was 3.04% for the entire period. There were no trend changes in the screening DBT service volumes for the entire period for Medicare patients (AQPC of 0.52% from 2019Q1 to 2022Q3).
Screening mammography
From 2019 Q1 to 2022 Q3, the 2D screening mammography volumes by patient insurance payor type are as follows: 729,918 for Com1, 77,268 for Com2, 51,844 for Com3, 160,816 for Medicaid, and 1,014,987 for Medicare.
Com1 patients had an inflection point in 2D screening mammography (SM) service volumes in 2020 Q4. The QPC was 4.32% from 2019 Q1 to 2020 Q4 and -0.35% from 2020 Q4 to 2022 Q3. The AQPC was 1.52% for the entire period. Com2 patients had an inflection point in SM service volumes in 2020 Q4; QPC of 10.04% from 2019 Q1 to 2020 Q4 and -0.58 from 2020 Q4 to 2022 Q3. The AQPC was 3.61% for the entire period. Com 3 didn’t have trend changes in the SM service volumes for the entire period (AQPC of -0.62% from 2019Q1 to 2022Q3)
SM service volumes by Medicaid patients had an inflection point in 2019 Q4; QPC of 11.66% from 2019 Q1 to 2019 Q4 and 2.10% from 2019 Q4 to 2022 Q3. The AQPC was 2.96% for the entire period. SM service volumes by Medicare patients had an inflection point in 2021 Q4; QPC of 2.80% from 2019 Q1 to 2021 Q4 and -1.48% from 2021 Q4 to 2022 Q3. The AQPC was 1.58% for the entire period.
Breast ultrasound
From 2019 Q1 to 2022 Q3, the breast ultrasound volumes by patient insurance payor type are as follows: 181,022 for Com1, 21,270 for Com2, 9,313 for Com3, 67,278 for Medicaid, and 173,666 for Medicare.
Com1 patients had an inflection point in breast ultrasound service volumes in 2020 Q1 and 2020 Q4; QPC of 0.75% from 2019 Q1 to 2020 Q1, 14.01% from 2020 Q1 to 2020 Q4, and 0.32% from 2020 Q4 to 2022 Q3. The AQPC was 1.67% for the entire period. Com2 patients had an inflection in breast ultrasound service volumes in 2019 Q4; a QPC of 34.24% from 2019 Q1 to 2019 Q4 and 2.28% from 2019 Q4 to 2022 Q3. The AQPC was 4.92% for the entire period. Com 3 didn’t have trend changes in the breast ultrasound service volumes for the entire period (AQPC of -0.95% from 2019Q1 to 2022Q3).
Breast ultrasound service volumes by Medicaid patients had inflection points in 2020 Q1 and 2020 Q4; a QPC of 1.74% from 2019 Q1 to 2020 Q1, 12.14% from 2020 Q1 to 2020 Q4, and 2.14% from 2020 Q4 to 2022 Q3. The AQPC was 2.91 for the entire period. Breast ultrasound services accessed by Medicare patients had an inflection point in 2019 Q4, with a QPC of 14.83% from 2019 Q1 to 2019 Q4, to 2.24% from 2019 Q4 to 2022 Q3. The AQPC was 3.36% for the entire period.
This study identified trends in breast imaging services over 45 months (2019 Q1 to 2022 Q3) in 75 radiology practices in the USA. Between the first quarter of 2019 and the third quarter of 2022, breast imaging services experienced multiple fluctuations in utilization among patients covered by various health insurance plans. Most of these fluctuations occurred in 2020, with a smaller number in 2019 and 2021. Nonetheless, there was an overall growth in the volume of nearly all breast imaging services used by patients with both private and government-provided health insurance throughout this period. An exception was found for patients with Com3 coverage, in which there was stable utilization of mammography, 2D screening mammography, and breast ultrasound services during the same period.
Except for patients covered by Com2, the data revealed that Medicare and Medicaid patients tended to have a higher rate of breast imaging service utilization per quarter (i.e., the average quarterly volume percentage change) over the entire period compared to those covered by Com1 and Com3. In terms of average quarterly volumes, Medicare and Com1 patients appeared to have utilized more breast imaging services (except for screening digital breast tomosynthesis) than the others, with Medicaid patients ranking third in most cases. These findings deviate from expectations and contrast with those from other studies, as previous studies suggest a higher utilization rate among commercially insured patients compared to publicly insured ones.
Research consistently shows that patients with private health insurance are more likely to access diagnostic and screening breast imaging services than those on Medicaid or Medicare. Clark, et al. [13] conducted a study examining the patterns of digital breast tomosynthesis (DBT) utilization among women aged 40-89 across 22 primary care centers from June 2011 to September 2014, analyzing its correlation with insurance type. They observed a consistent increase in DBT usage across all insurance categories throughout the study period [13]. However, during the latest observed period, the utilization of screening DBT was notably higher among individuals covered by private insurance (43.4%) compared to those covered by Medicaid (36.2%), Medicare (37.8%), other insurance plans (38.6%), or lacking insurance altogether (32.9%; p < 0.0001) [13]. There were no sustained discrepancies in DBT usage for diagnostic purposes based on insurance type [13].
Murphy, et al. [14] found that breast imaging sites with higher rates of private insurance patients were more likely to utilize advanced diagnostic care practices, such as breast MRI and image-guided biopsy. Gold [15] further highlighted the influence of insurance-related factors on the use of breast MRI and other advanced breast imaging, with commercial health plans, younger age, and prescription drug plans being associated with a higher likelihood of receiving these services. Similar disparities were found in the context of breast cancer care by Churilla, et al. [16]. Their research demonstrated significant differences in breast cancer care in the US associated with insurance status, with patients covered by commercial insurance being more likely to undergo breast-conserving surgery (BCS) compared to those covered by Medicaid or uninsured individuals [16]. Additionally, radiotherapy following BCS was more frequently omitted among patients covered by Medicaid or lacking insurance [16].
The study results also reveal a pattern of seasonal trends, demonstrated as low-volume inflection points at the first quarter of each year, with an initial downward trend followed by a trend reversal towards the end of the year. Multiple studies demonstrate significant seasonal trends in healthcare service utilization across various medical domains. Haimovich, et al. [17] found that 164 out of 263 clinical conditions showed statistically significant seasonality in hospital utilization. Moineddin, et al. [18] specifically noted a threefold increase in primary care visits for respiratory diseases during winter. Castner, et al. [19] revealed that emergency department utilization varies by season, with higher volumes in summer and fall. The evidence is robust, spanning multiple healthcare settings: psychiatric services [20], emergency departments, primary care, and overall hospitalizations [21].
Commercial versus government-provided medical insurance coverage rates
In the US, private health insurance, mostly employer-sponsored, contributes to a greater proportion of health insurance coverage. For 2020, the private and public insurance coverage was about 66.5% percent and 34.8%, respectively [22]. The most recent data for 2021 showed that private health insurance coverage remained higher (66.0%) than government-provided insurance (35.7%) [23]. From 2018 to 2020, private health insurance coverage rates decreased by 0.8%, while public insurance increased by 0.4% [22]. Between 2020 and 2021, there was a 1.2%-point increase in public insurance coverage [23]. Medicaid’s coverage rate increased by 0.9%, with increased enrollment reported in 2020 [22,23]. Overall, there were more insured Americans in 2021 than in 2020 (8.3% uninsured Americans in 2021 versus 8.6% uninsured Americans in 2020) [23]. This could have played a factor in the observed overall higher rates of breast imaging services per quarter seen over time at this practice [24].
Implications of the study findings
Recent years have witnessed a 0.5% annual increase in breast cancer incidence rates in the US [25], with 239,612 new cases of female breast cancer and 42,273 related deaths reported in 2020 [26]. Although the incidence rate is higher among white females than black females, mortality rates are disproportionately elevated in the latter group, highlighting disparities in healthcare quality and outcomes [27]. By 2050, the projected US population is estimated to reach 399 million (assuming net international immigration remains constant) [28], with an anticipated annual average of 362,700 breast cancer cases [29]. Based on these projections and our study findings, we anticipate a further rise in breast imaging service volumes across all patient insurer types.
The implications of our findings suggest the potential need for expanding services to accommodate the growing demand for breast imaging services. This mirrors the overall increased demand for radiology services nationally. Strategies will need to be considered to address the growth in demand, including those aimed at personnel, technology, and access.
Of particular interest in this study was the high rates of utilization and growth amongst the governmental payor cohorts (Medicare/Medicaid). This is different than previous research, which has suggested that individuals with private health insurance have better access to screening and diagnostic breast imaging services compared to those with government coverage.
Study limitations
Data used in the study narrowed analysis to patients who were covered by these 3 private insurers, Medicaid, and Medicare. This leaves out the trend analysis for patients on other types of insurance or who use other private insurers. However, this study still provides valuable insights into healthcare service utilization trends of those on private insurance and how they compare to government-insured patients. Although patients on government-provided insurance appeared to have utilized more breast imaging services at a higher rate per quarter over the entire period, it does not necessarily translate to a better health outcome than those on commercial health insurance. Additional data on measurable health outcome indices will be needed to evaluate disparities.
In our cross-sectional study of the trend in breast imaging services utilization among privately and government-insured patients we found out that across an array of radiology practices in the US, there has been growth in the volume of almost all breast imaging services utilized by most patients on the five chosen health insurances (Com1, Com2, Com3, Medicaid, and Medicare) from 2019 Q1 to 2022 Q3. Medicare and Medicaid patients had a higher rate of breast imaging service utilization (except for screening digital breast tomosynthesis and those on Com2) over the entire period than those on private health insurance. In terms of average quarterly volumes, Medicare and Com1 patients in aggregate utilized more breast imaging services (except for screening digital breast tomosynthesis) than the rest, with Medicaid patients coming in third in the ranks in most cases. Future studies are needed to determine if these variable rates of utilization are linked with disparities in health outcomes.
- Joe BN, Sickles EA. The evolution of breast imaging: past to present. Radiology. 2014;273(2 Suppl):S23–S44. Available from: https://doi.org/10.1148/radiol.14141233
- Magny SJ, Shikhman R, Keppke AL. Breast Imaging Reporting and Data System (BI-RADS®). American College of Radiology. 2023. Available from: https://www.ncbi.nlm.nih.gov/books/NBK459169/
- Bassett LW. Standardized reporting for mammography: BI‐RADS™. Breast J. 1997;3(5):207–210. Available from: https://doi.org/10.1111/j.1524-4741.1997.tb00172.x
- Byfield SD, Wimmer K, Adajar BA, Onglao P, Fredrickson A, Ventura ME, Staib J, Catlett K, Soonavala R, Kim M-O, Fiscalini A, Esserman L. Abstract P3-04-02: Real-world evidence demonstrates replacement of 2D mammography with 3D mammography among insured women. Cancer Res. 2022;82(4 Suppl):P3-0402–P3-0402. Available from: https://doi.org/10.1158/1538-7445.sabcs21-p3-04-02
- Boroumand G, Teberian I, Parker L, Rao VM, Levin DC. Screening mammography and digital breast tomosynthesis: utilization updates. AJR Am J Roentgenol. 2018;210(5):1092–1096. Available from: https://doi.org/10.2214/AJR.17.18767
- Bernstein MH, Baird GL, Lourenco AP. Digital breast tomosynthesis and digital mammography recall and false-positive rates by time of day and reader experience. Radiology. 2022;303(1):63–68. Available from: https://doi.org/10.1148/radiol.210318
- Onega T, Hubbard R, Hill D, Lee CI, Haas JS, Carlos HA, Alford-Teaster J, Bogart A, DeMartini WB, Kerlikowske K, Virnig BA, Buist DS, Henderson L, Tosteson AN. Geographic access to breast imaging for US women. J Am Coll Radiol. 2014;11(9):874–882. Available from: https://doi.org/10.1016/j.jacr.2014.03.022
- Decker SL. In 2011, nearly one-third of physicians said they would not accept new Medicaid patients, but rising fees may help. Health Aff (Millwood). 2012;31(8):1673–1679. Available from: https://doi.org/10.1377/hlthaff.2012.0294
- Côté MJ, Smith MA. Forecasting the demand for radiology services. Health Syst (Basingstoke). 2017;7(2):79–88. Available from: https://doi.org/10.1080/20476965.2017.1390056
- Centers for Medicare & Medicaid Services. List of CPT/HCPCS codes. Accessed 2023 May 11. Available from: https://www.cms.gov/Medicare/Fraud-and-Abuse/PhysicianSelfReferral/List_of_Codes
- StataCorp. Stata statistical software: release 18. College Station (TX): StataCorp LLC; 2023.
- National Cancer Institute. Joinpoint Regression Program, Version 5.0.1. May 2023. Statistical Methodology and Applications Branch, Surveillance Research Program. Available from: https://surveillance.cancer.gov/help/joinpoint
- Clark CR, Tosteson TD, Tosteson ANA, Onega T, Weiss JE, Harris KA, Haas JS. Diffusion of digital breast tomosynthesis among women in primary care: associations with insurance type. Cancer Med. 2017;6(5):1102–1107. Available from: https://doi.org/10.1002/cam4.1036
- Murphy A, Weldon C, Trosman J, Schink J, Ansell D, Simon M. Does insurance mix impact utilization of published care practices and guidelines among breast imaging sites? J Clin Oncol. 2014;32:150–150. Available from: https://doi.org/10.1200/jco.2014.32.30_suppl.150
- Gold LS, Buist DS, Loggers ET, Etzioni R, Kessler L, Ramsey SD, Sullivan SD. Advanced diagnostic breast cancer imaging: variation and patterns of care in Washington State. J Oncol Pract. 2013;9(5):e194–e202. Available from: https://doi.org/10.1200/JOP.2012.000796
- Churilla TM, Egleston B, Bleicher R, Dong Y, Meyer J, Anderson P. Disparities in the local management of breast cancer in the US according to health insurance status. Breast J. 2017;23(2):169–176. Available from: https://doi.org/10.1111/tbj.12705
- Haimovich JS, Venkatesh AK, Shojaee A, Coppi A, Warner F, Li SX, Krumholz HM. Discovery of temporal and disease association patterns in condition-specific hospital utilization rates. PLoS One. 2017;12(3):e0172049. Available from: https://doi.org/10.1371/journal.pone.0172049
- Moineddin R, Nie JX, Domb G, Leong AM, Upshur RE. Seasonality of primary care utilization for respiratory diseases in Ontario: a time-series analysis. BMC Health Serv Res. 2008;8:160. Available from: https://doi.org/10.1186/1472-6963-8-160
- Castner J, Yin Y, Loomis D, Hewner S. Medical Mondays: ED utilization for Medicaid recipients depends on the day of the week, season, and holidays. J Emerg Nurs. 2016;42(4):317–324. Available from: https://doi.org/10.1016/j.jen.2015.12.010
- Singh GP, Chavan BS, Arun P, Sidana A. Seasonal pattern of psychiatry service utilization in a tertiary care hospital. Indian J Psychiatry. 2007;49(2):91–95. Available from: https://doi.org/10.4103/0019-5545.33254
- Crighton EJ, Moineddin R, Upshur RE, Mamdani M. The seasonality of total hospitalizations in Ontario by age and gender: a time series analysis. Can J Public Health. 2003;94(6):453–457. Available from: https://doi.org/10.1007/BF03405084
- United States Census Bureau. Health insurance coverage in the United States: 2020. Accessed 2023 Mar 17. Available from: https://www.census.gov/library/publications/2021/demo/p60-274.html
- United States Census Bureau. Health insurance coverage in the United States: 2021. Accessed 2023 May 18. Available from: https://www.census.gov/library/publications/2022/demo/p60-278.html
- United States Census Bureau. Employment-based health insurance declines for working-age adults during pandemic. Accessed 2023 May 18. Available from: https://www.census.gov/library/stories/2021/09/private-health-coverage-of-working-age-adults-drops-from-early-2019-to-early-2021.html
- American Cancer Society. Key statistics for breast cancer. Accessed 2023 Jun 5. Available from: https://www.cancer.org/cancer/types/breast-cancer/about/how-common-is-breast-cancer.html
- Centers for Disease Control and Prevention. Cancer statistics at a glance. Accessed 2023 Jun 5. Available from: https://gis.cdc.gov/Cancer/USCS/#/AtAGlance/
- Giaquinto AN, Sung H, Miller KD, Kramer JL, Newman LA, Minihan A, Jemal A, Siegel RL. Breast cancer statistics, 2022. CA Cancer J Clin. 2022;72(6):524–541. Available from: https://doi.org/10.3322/caac.21754
- United States Census Bureau. United States population projections: 2000 to 2050. Accessed 2023 Jun 5. Available from: https://www.census.gov/content/dam/Census/library/working-papers/2009/demo/us-pop-proj-2000-2050/analytical-document09.pdf
- Centers for Disease Control and Prevention. Cancer incidence projections in the United States between 2015 and 2050. Accessed 2023 Jun 5. Available from: https://www.cdc.gov/pcd/issues/2021/21_0006.htm